这几天在赶论文deadline,由于是第一次写论文,要学的真不少:(
论文和LDA有关,肯定少不了要在tex中插入LDA图模型,用什么工具画图呢?
tikz-bayesnet
一句话介绍bayesnet: TikZ library for drawing Bayesian networks, graphical models and (directed) factor graphs in LaTeX.
这个也是我这次使用的,语法非常简单。
bayesnet支持以下结点(node)类型:
- latent
- obs
- det
- const
- factor
- plate
- gate
使用时一共也就7类命令:
- \factor [options] {factorname}{caption}{inputs}{outpus}
- \plate [options] {platename}{fitlist}{caption}
- \gate [options] {gatename}{fitlist}{inputs}
- \vgate {vgatename}{fitlist-left}{caption-left}{fitlist-right}{caption-right}{inputs}
- \hgate {hgatename}{fitlist-top}{caption-top}{fitlist-bottom}{caption-bottom}{inputs}
- \edge [options] {inputs}{outputs}
- \factoredge [options] {inputs}{factors}{outputs}
看到这里,你可能会被options, caption, fitlist等各种参数绕晕,别急,我们来看一个例子,使用时非常简单滴。
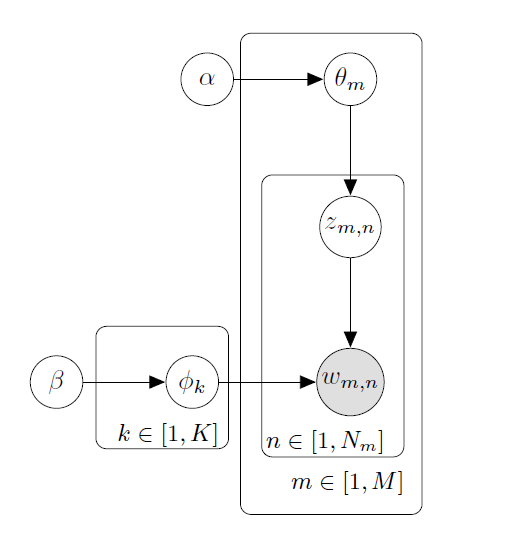
让我们来画一个LDA流程图。
{% codeblock lang:latex %}

\documentclass[11pt]{report}
\usepackage{tikz}
\usetikzlibrary{bayesnet}
\begin{document}
    \begin{figure}
      \centering
      \tikz{ %
		\node [latent](beta){$\beta$}; %
		\node [latent, right=1.1 of beta](phi){$\phi_{k}$}; %
		\node [obs, right=1.3 of phi](w) {$w_{m,n}$}; %
		\node [latent, above=1.2 of w](z) {$z_{m,n}$}; %
		\node [latent, above=1.2 of z](theta){$\theta_{m}$};
		\node [latent, left=1.2 of theta](alpha){$\alpha$};

		\plate [inner sep=0.2cm, xshift=-0.08cm, yshift=0.18cm]{plate1}{(phi)}{$k\in[1, K]$};
		\plate [inner sep=0.15cm, xshift=0.1cm, yshift=0.12cm]{plate2}{(z)(w)} {$n\in[1,N_{m}]$};

		\plate [inner sep=0.25cm, xshift=-0.02cm, yshift=0cm]{plate3}{(theta)(plate2)}{$m\in[1, M]$};

		\edge {alpha}{theta};
		\edge {theta}{z};
		\edge {beta}{phi};
		\edge {phi, z}{w};
      }
    \end{figure}
    \end{document}
{% endcodeblock %}
 大概是因为使用起来实在很简单,作者并没有提供document,你可以仔细看看作者提供的几个examples,相信聪明的你肯定会掌握:)
DAFT
一句话介绍:Render some probabilistic graphical models using matplotlib.
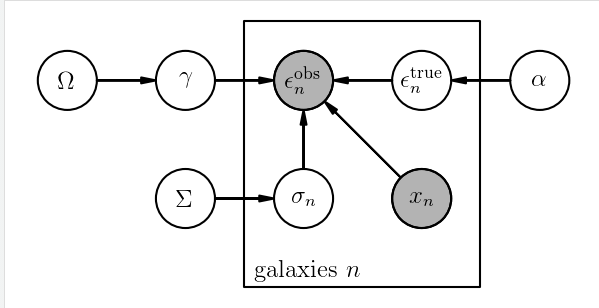
我看了下example, 使用起来也非常简单。
{% codeblock lang:python %}
from matplotlib import rc
rc("font", family="serif", size=12)
rc("text", usetex=True)
rc("./weaklensing.tex")

import daft

pgm = daft.PGM([4.7, 2.35], origin=[-1.35, 2.2])
pgm.add_node(daft.Node("Omega", r"$\Omega$", -1, 4))
pgm.add_node(daft.Node("gamma", r"$\gamma$", 0, 4))
pgm.add_node(daft.Node("obs", r"$\epsilon^{\mathrm{obs}}_n$", 1, 4, observed=True))
pgm.add_node(daft.Node("alpha", r"$\alpha$", 3, 4))
pgm.add_node(daft.Node("true", r"$\epsilon^{\mathrm{true}}_n$", 2, 4))
pgm.add_node(daft.Node("sigma", r"$\sigma_n$", 1, 3))
pgm.add_node(daft.Node("Sigma", r"$\Sigma$", 0, 3))
pgm.add_node(daft.Node("x", r"$x_n$", 2, 3, observed=True))
pgm.add_plate(daft.Plate([0.5, 2.25, 2, 2.25],
        label=r"galaxies $n$"))
pgm.add_edge("Omega", "gamma")
pgm.add_edge("gamma", "obs")
pgm.add_edge("alpha", "true")
pgm.add_edge("true", "obs")
pgm.add_edge("x", "obs")
pgm.add_edge("Sigma", "sigma")
pgm.add_edge("sigma", "obs")
pgm.render()
pgm.figure.savefig("weaklensing.pdf")
pgm.figure.savefig("weaklensing.png", dpi=150)
{% endcodeblock %}

嗯,python果然很强大,以后有时间玩一下。
Graphvie
What is Graphviz? Graphviz is open source graph visualization software. Graph visualization is a way of representing structural information as diagrams of abstract graphs and networks. It has important applications in networking, bioinformatics, software engineering, database and web design, machine learning, and in visual interfaces for other technical domains.